What are you looking for?
Most searched
Others were looking for...
Popular services
Our most popular services and solutions

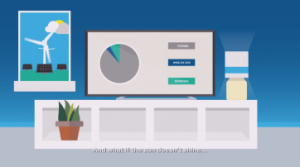
Client:TU Delft (University of Technology Delft)
Subject:Data Insights
Style:Custom Animation
Language:English
Story:How can data help TU Delft to remain a world-leading university? Cooler Media explained it in this animation video.
TU Delft chose a
Custom Animation to explain how data can help the University to maintain its leading status. In this way, it is communicated in an understandable way which data is used and how the Data Insights team works.
A calm and businesslike design has been chosen in the blue corporate identity color of TU Delft, in order to properly explain the complex data process. Ultimately, the animation will mainly be used for internal communication; for example on the TU Delft website, in a presentation or sent in an online newsletter.
Oops! We could not locate your form.
To remain a world-leading university,
TU Delft needs better insight into the impact of our policies and decisions. How can
data help to provide this insight?
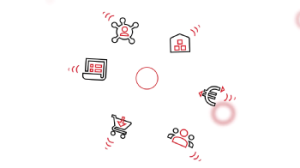
The
Data Insights Team is here to help you see, and understand, the power and value of your data.
Based on your questions, we identify the insights you require and collect the data. We build the visualisation and continue working with you until we have a product that provides the information you need.
We will
publish your dashboard on MiFOCUS where it can be accessed by you and other relevant users. Depending on the source of the data, your dashboard will be automatically refreshed.
What kind of insights do you need? E-mail your questions to the Data Insights Team.
Fill in the form and we will get back to you within an hour.
Or just give us a call +31 (0)76-8867790
[layerslider id=”67″]