Infographic production

Our infographics make complex matters and ideas instantly understandable at a glance.

Talk to our experts Working method

Icon - Infographic

Why create an infographic?

An infographic allows you to easily explain complex information in a single visual overview. It is often referred to as a “visual story.” The human brain is highly visually oriented, and infographics help make factual information visually appealing to the reader. With strong information design, clear icons and symbols, and concise text, infographics perfectly complement explainer animations or videos.

Here are some advantages of creating an infographic:

  • Complex information is made clear at a glance.
  • Visual information is understood 60,000 times faster than text.
  • Can be read at one’s own pace.
  • Perfect for lead generation or social media posts.

Would you like to have an infographic designed? Let us provide you with free advice.

Talk to our experts

Infographics we're proud of

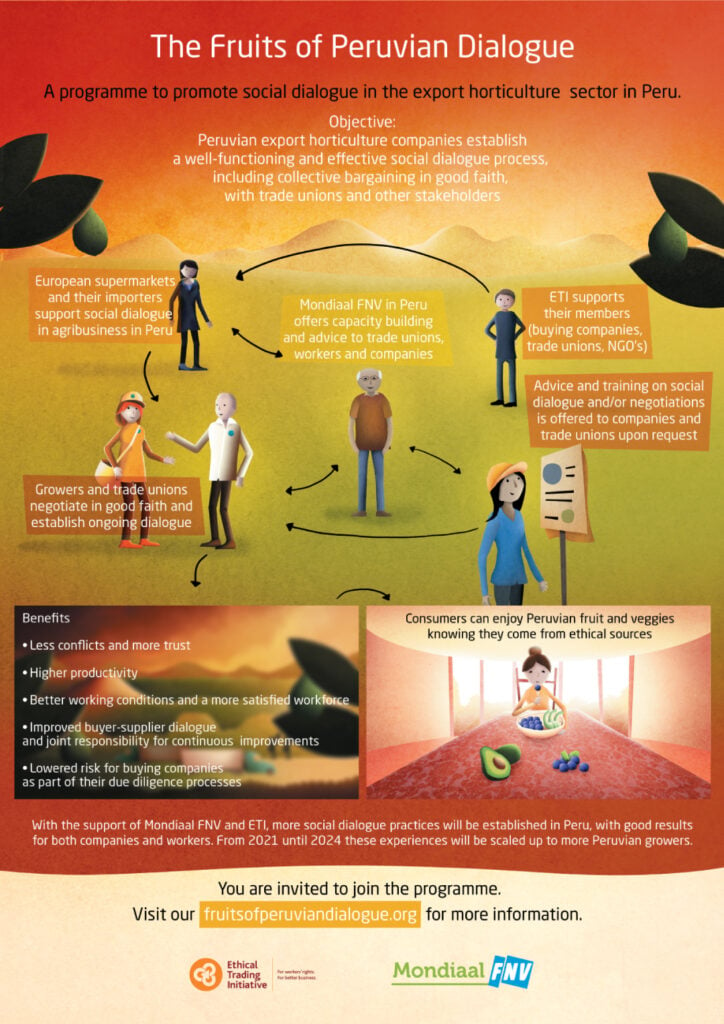
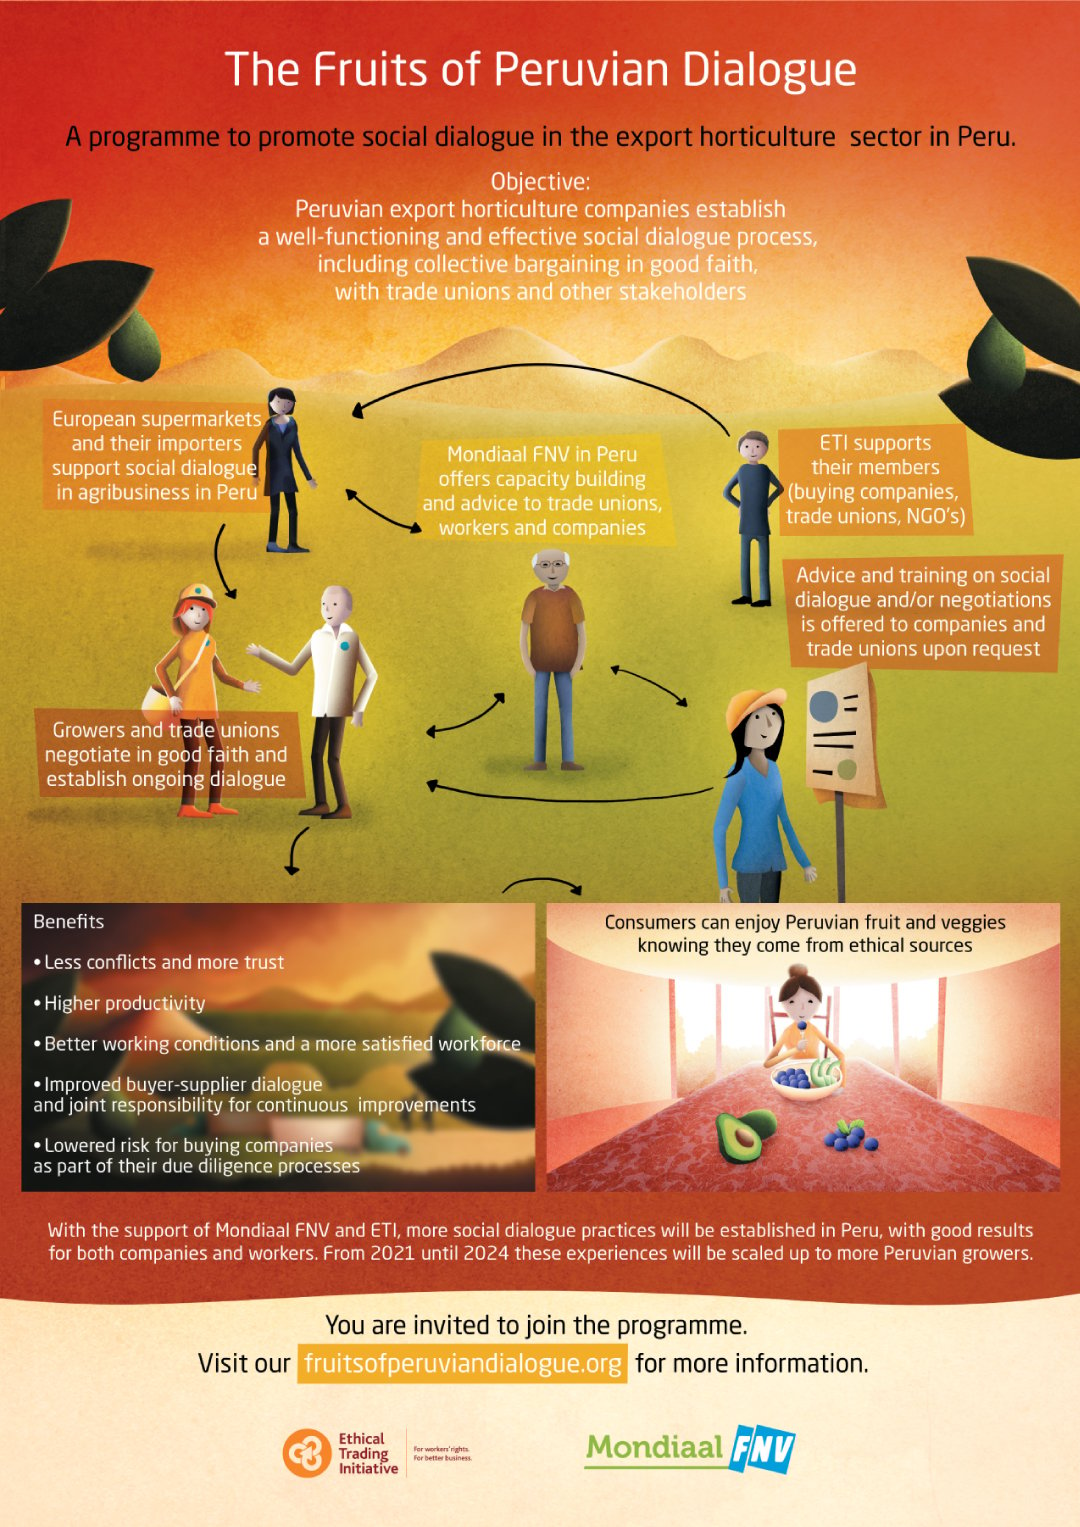
Infographic - Mondial FNV

Mondiaal FNV
Social Dialogue Peru

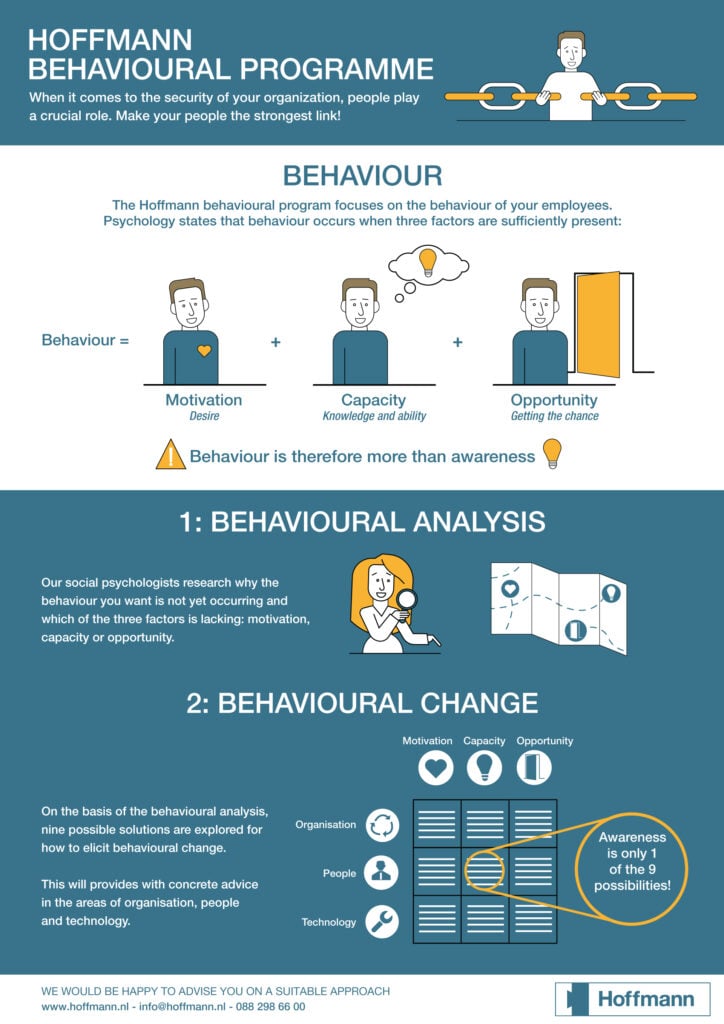
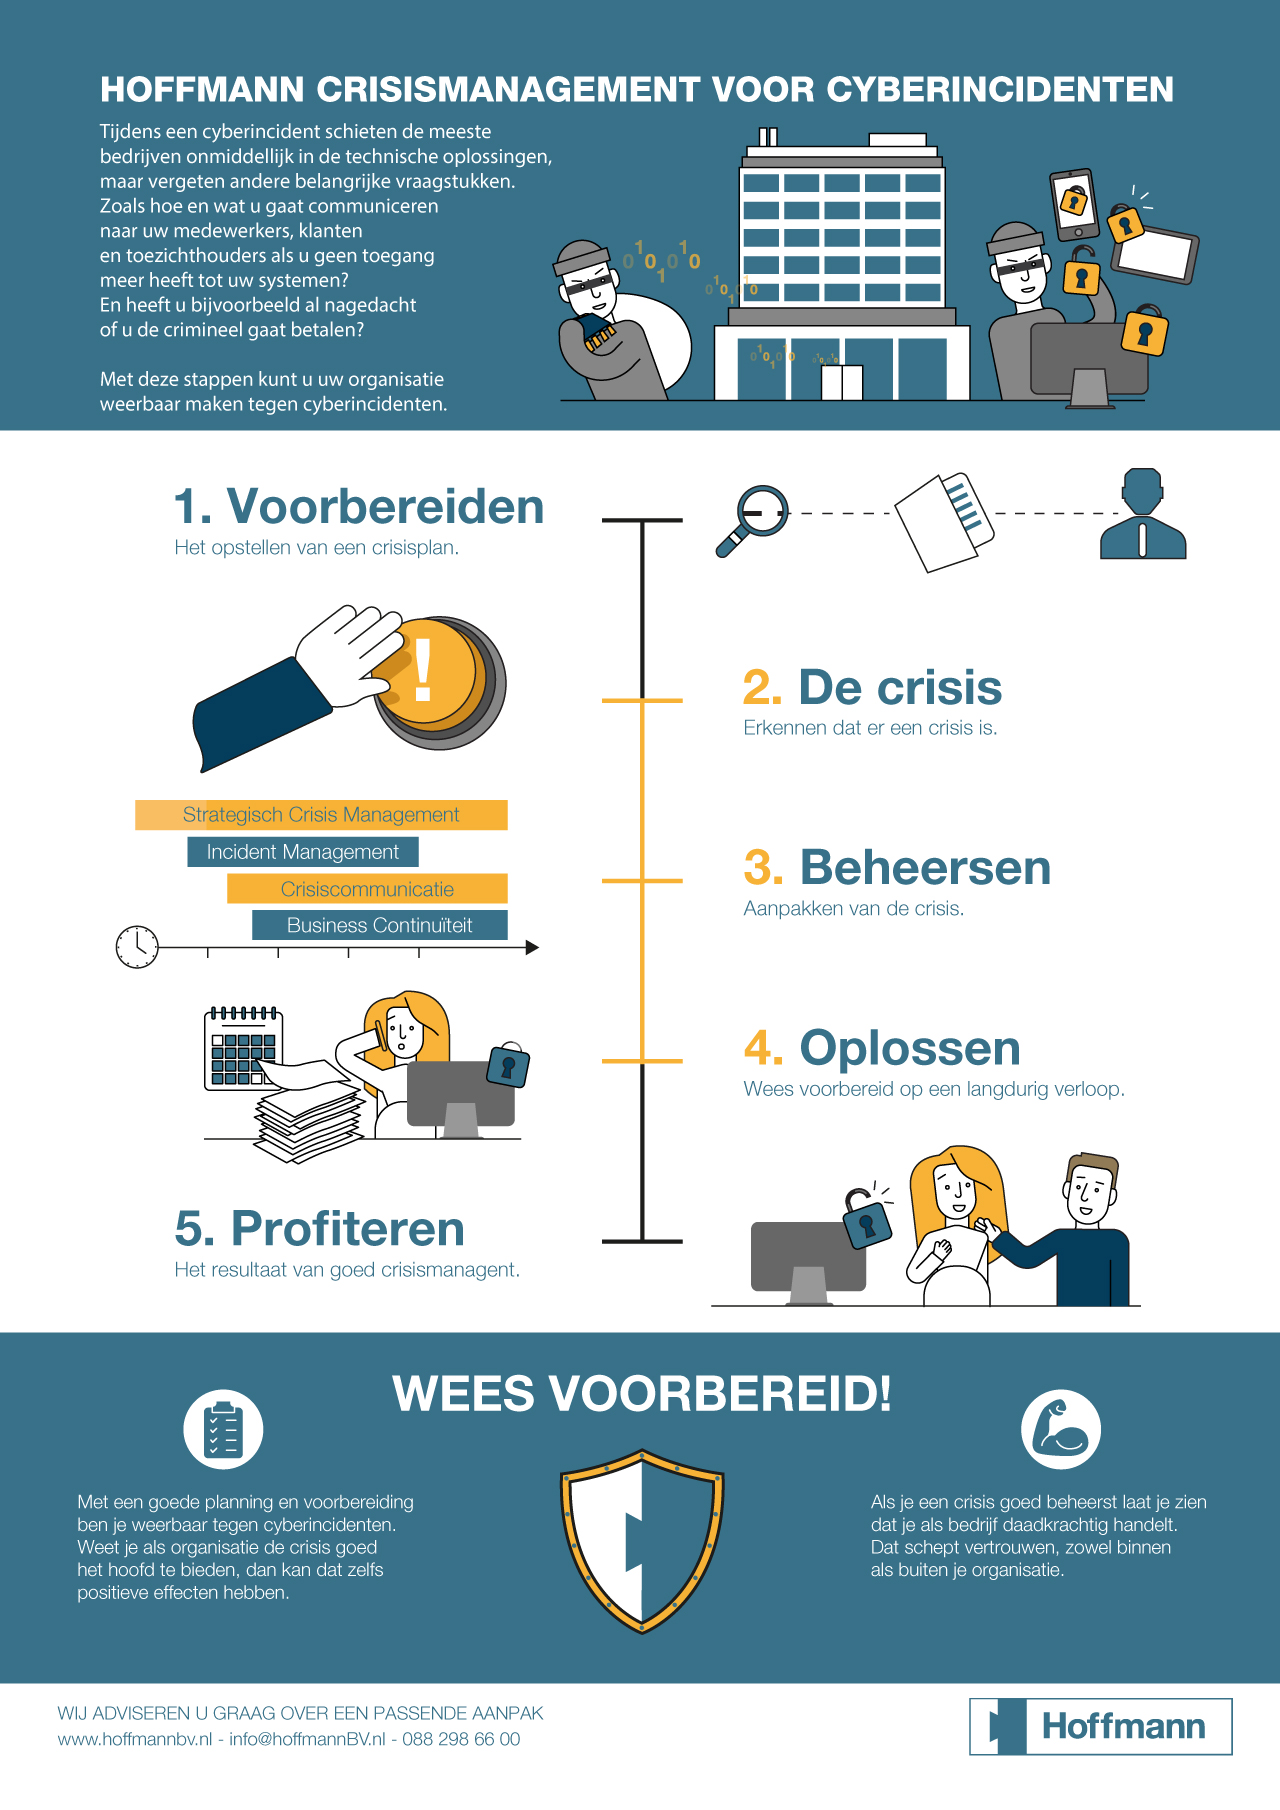
Portfolio - Hoffman

Hoffmann
Behavioural programme

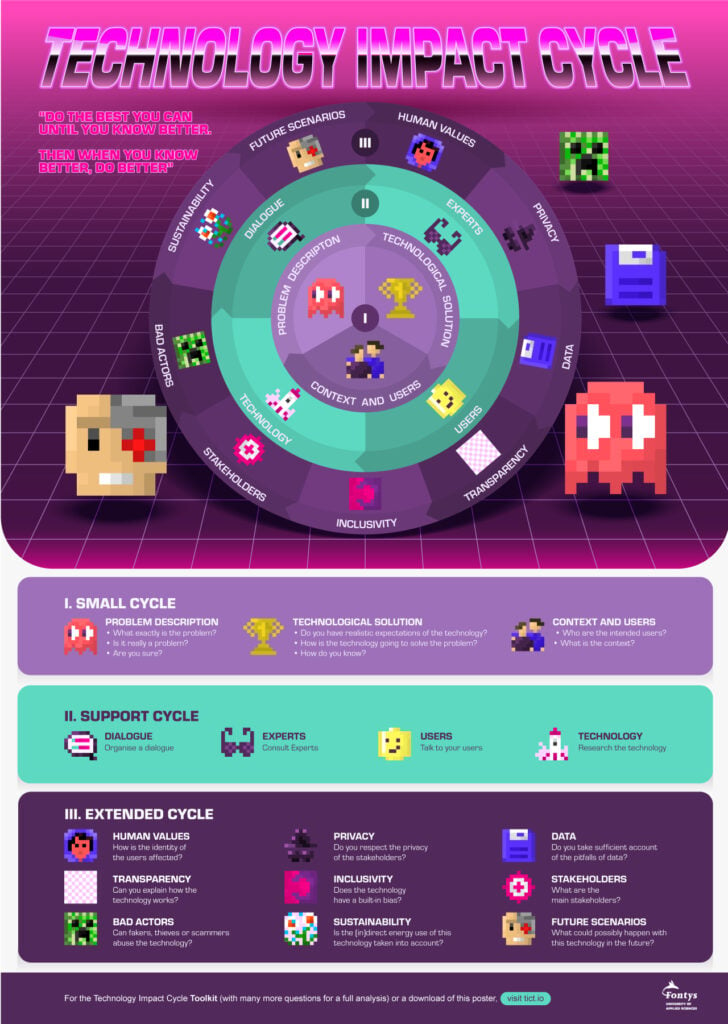
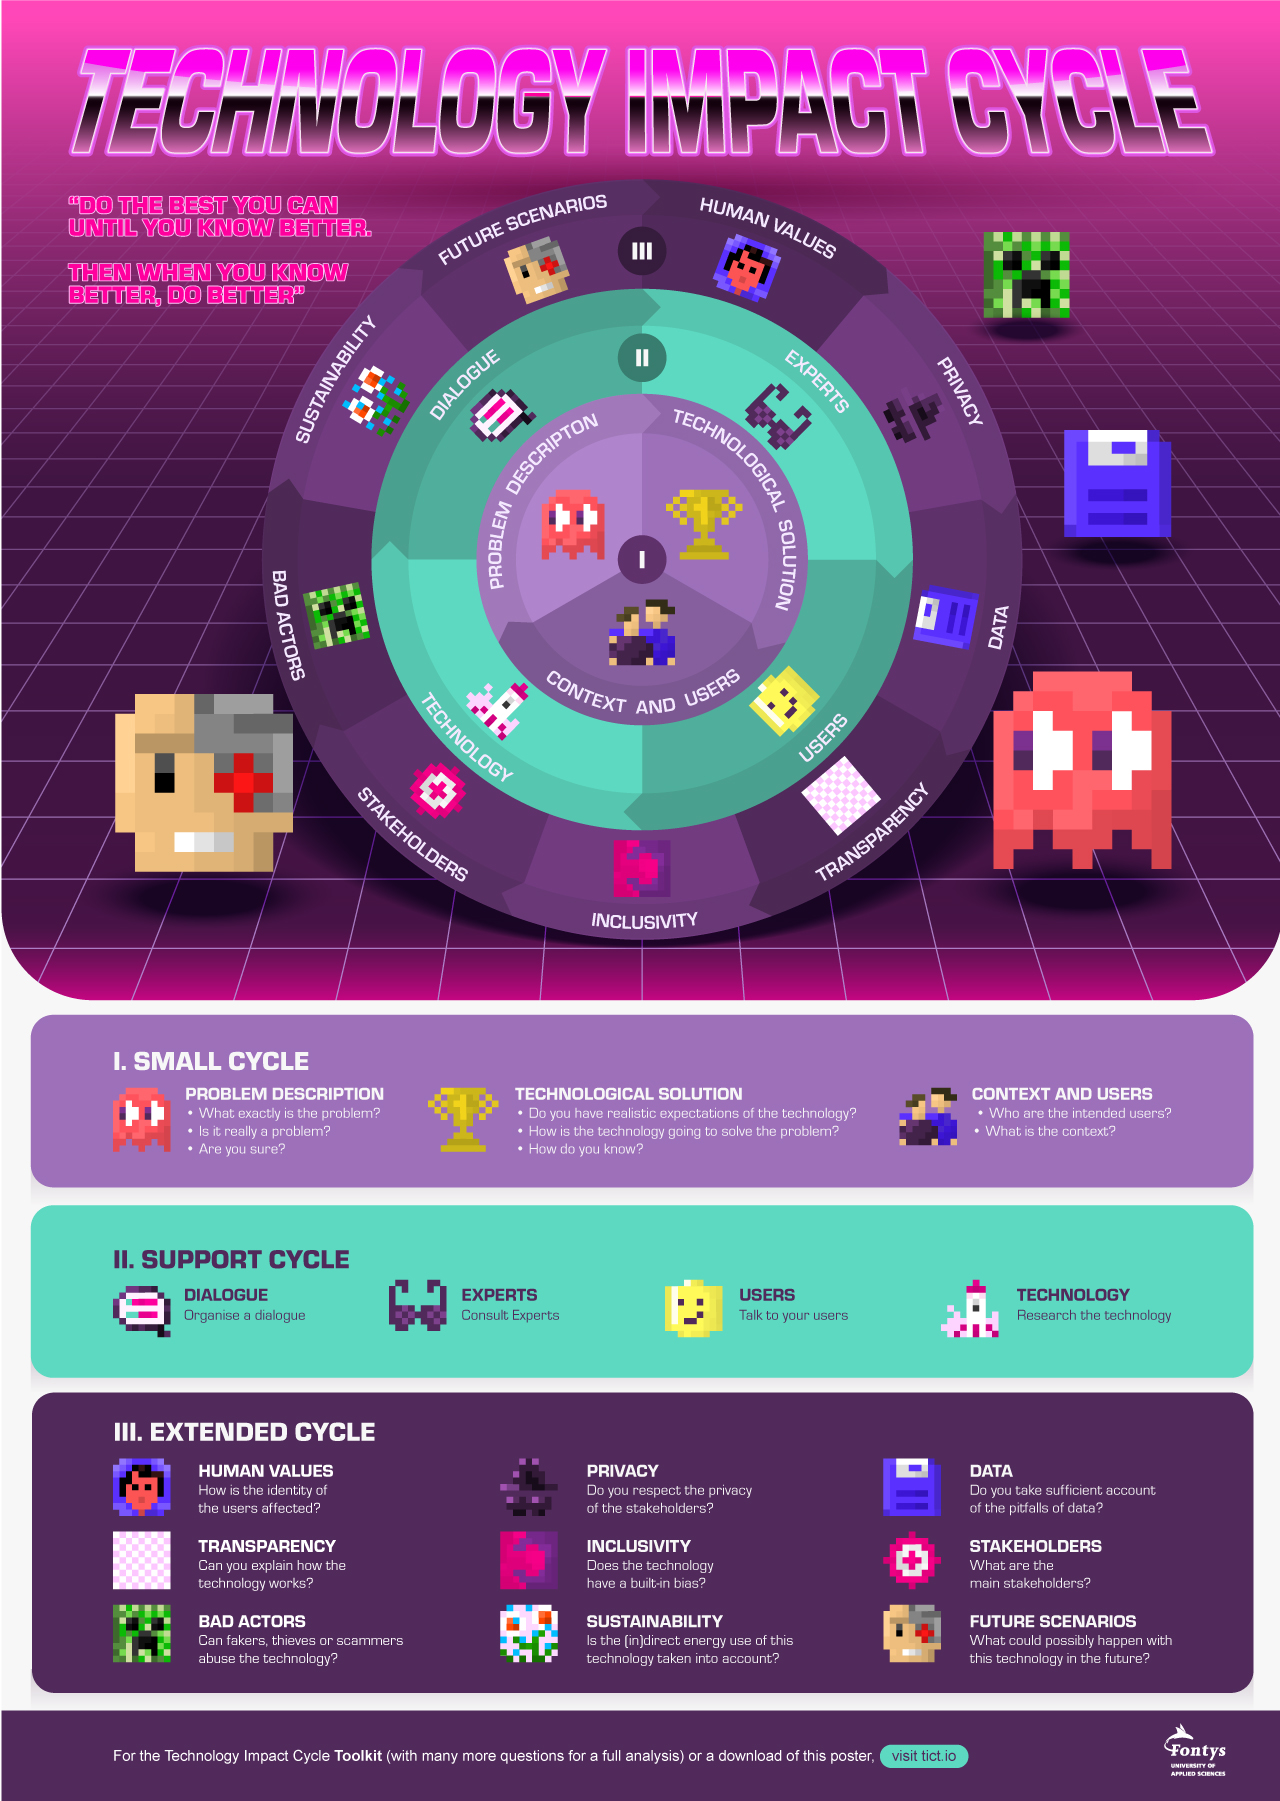
Infographic - Fontys Hogescholen
Logo Fontys Hogescholen

Fontys University of Applied Sciences
Technology Impact Cycle

Consistently rated 9+ by our clients

The infographic production process

In the first phase, we schedule a Magic Meeting to discuss the content in detail. After this, we analyze and structure the information, replacing text with clear illustrations to significantly reduce the amount of text needed to convey your message. If necessary, we conduct additional research. During this phase, you can also choose between a customized infographic or one of our pre-designed styles. Based on your choice, we develop the first sketch and you have the opportunity to provide immediate feedback. This enables us to start working on the final design that perfectly matches your wishes as soon as possible.

Icon - Meeting

During this phase of the production process, we combine the concepts, sketches, and text into a first version of the infographic. Depending on which package you choose, we either develop a customized visual or use our pre-designed icons. We always give a personal twist to every design. Additionally, we invite you to offer feedback on all aspects of the design. After the design period, we can also animate your infographic into a complementary video.

Icon - Design

To get the most out of your investment, we offer optional assistance with the online marketing of your infographic. We help you spread your message and allow it to reach your target audience. We use smart and proven online marketing techniques to ensure your product, idea, or service captures the attention of potential clients effectively.

Icon - Verspreiding

Why choose
Cooler Media?

  • We work with a clear, proven strategy to achieve the best results
  • Top-quality audio and video production for every budget
  • Over 3,000 unique explainer videos delivered in 13+ years of hard work
  • Free, expert advice for every service
  • Fast delivery to meet your deadlines
  • No surprises – always a fixed price for every project
  • Consistently rated 9+ by our clients
Icon - Workshop waarom

Interactive infographics

We introduced interactive infographics in the Netherlands. An interactive infographic is a unique combination of the traditional (static) PDF and a one-page website.

Unlike traditional static infographics, interactive infographics allow users to interact with the information and explore it in different ways. This enables a wealth of information to be presented without sacrificing clarity and overview. By layering the information, each part of the infographic remains easily digestible for website visitors.

To make the world more understandable, it’s important that everyone can comprehend a message and use digital content in a way that is clear to them. This means that digital information should be accessible to everyone, regardless of any limitations or disabilities.

That’s why we offer our clients the option to make their interactive designs—such as infographics, PDFs, brochures, and websites—accessible to all. This ensures that digital information is available to individuals with auditory, cognitive, or visual, impairments.


Some characteristics of interactive infographics include:

  • Interactivity: Users can click, scroll, zoom in and out, or interact with the elements of the infographic. These actions can reveal more detailed information, present different views of the data, or allow the user to explore the information in a personalized manner.
  • Use of multimedia: Interactive infographics can incorporate text, images, animations, videos, audio, and other multimedia elements to present information and enhance the user experience.
  • Data visualization: They visualize complex data and information in an easy-to-understand and memorable way. This can take the form of charts, diagrams, maps, timelines, and other visual elements.
  • User-centric experience: By allowing users to interact with the information and explore it in a personalized way, interactive infographics create a more engaging and user-centric experience.
Talk to an expert

Frequently asked questions

A picture is worth a thousand words. Research consistently shows that humans process, interpret, and remember information conveyed through visuals much better than through text. Still not convinced?

  • It only takes one-tenth of a second to capture the message conveyed in an infographic (The SAGE Handbook of Political Communication)
  • You only need 150 milliseconds to process a symbol and interpreting it takes just 100 milliseconds (Journal of Cognitive Neuroscience)
  • Infographics help tackle the issue of information overload. On average, we consume around 34 GB of information outside of work! (Journal of Communication)
  • When color is used in an infographic, consumers’ willingness to read a document increases by 80% (Marketing Communications).

The ideal form of an infographic depends on your message, goal, and target audience. This is why we will discuss these matters extensively during the first briefing. Due to years of experience, we can transform your message into clear-cut visuals.

The time required to transform your idea, product, or service into a clear infographic depends on the type of infographic you choose. The main difference lies in the varying levels of detail in the visuals. Our infographics have the following production timelines:

  • Standard infographic: 3 days
  • Customized infographic: 4 days
  • Interactive infographic: 10 days

Need your infographic even quicker than that? No problem. Due to our efficient production process, we can develop your infographic even faster. Crucial is the speed at which you can provide feedback and, of course, a tight schedule.

When you choose us to develop an infographic, you have three packages to choose from, tailored to meet various preferences and budgets. These packages differ in the level of detail, originality, rounds of feedback, and, consequently, price.

  • Smart Infographic: Uses simpler icons, providing a straightforward and budget-friendly option.
  • Customized Infographic: Everything is custom-designed for your organization, offering the highest level of originality and detail.
  • Pre-Designed Infographic: Falls in between the two options, allowing you to choose from three set designs at an attractive price.

Of course, you want to see some numbers. No problem—we are transparent about our pricing. Give us a call, and within 5 minutes, you’ll know the cost of the type of infographic you want. Want to know which package best fits your organization’s needs, preferences, and budget? Contact one of our experts, they will advise you on the matter for free, no strings attached.

To successfully produce an infographic that matches your organizations style, we need:

  • Your organization’s style guide
  • Your logos, either vector-based or in illustrator
  • Earlier design work
  • Your organization’s color codes

Are you having trouble finding or sending these documents? Contact us through [email protected].

Our designers excel at effectively conveying your message through visuals, while our copywriters are experts at distilling key information from your story into concise texts. To ensure we deliver a product of the highest quality, we handle the entire infographic design process from start to finish. However, we can use your ideas as inspiration.

Our expertise goes further than making animations and shooting good film material. We think along with you about the distribution of your videos, help you set up a strategy, and ensure a flawless design that matches your corporate identity. Therefore, our services can be divided into 5 areas of expertise:

Cooler Media _ Lars Weijers - rond

Lars Weijers
Accountmanager

Cooler Media - Helen Berger

Helen Berger
Creative producer

Cooler Media - Julie van Rooij

Julie van Rooij
Online Marketer

Cooler Media - Daniel Visscher

Daniël Visscher
Art Director

Do you have any questions?

Our experts are here to help. Leave us a message!

"*" indicates required fields